How to Read Earnings Transcripts: A Guide Using AMZN, BAC & COST
The press release headline tells you revenue went up. The earnings transcript tells you why, and whether it will continue. For readers working through their first call, that distinction is easy to miss. The headline filters for drama; the transcript contains the actual structure of the business. This guide uses three Q3/Q4 2026 earnings calls from Amazon.com (AMZN), Bank of America (BAC), and Costco Wholesale (COST) as a cross-sector teaching set, illustrating five practical skills that separate signal from noise.
Skill 1: Parse the Opening Narrative for Management's Chosen Emphasis
Executives do not open calls by reading a table of numbers. They frame a story, and the story they choose to frame tells you which metrics management considers most important and, often, what they expect analysts to track going forward.
Amazon's Q3 2026 call is a useful example. CEO Andy Jassy spent significant time on the AWS flywheel, the relationship between AI demand, custom silicon, and cloud infrastructure expansion. The numbers anchored the narrative: AWS grew 39.3% year over year, its sixth consecutive quarter of acceleration, and the AWS backlog stood at $578B, growing triple digits year over year. That backlog figure, which measures contracted but not yet recognized revenue, rarely appears in a press release headline. Jassy's decision to lead with it signaled that forward momentum, not just current-period revenue, was his intended message.
Contrast that with a call that opens on cost controls or regulatory items. Management emphasis is a signal worth noting before diving into the financial tables. What executives choose to contextualize first is at least as informative as what they report.
Skill 2: Reconcile Reported vs. Adjusted Figures
Reported (GAAP) earnings and adjusted earnings can diverge substantially in a single quarter. Building a reliable trend picture requires understanding which number to use and why.
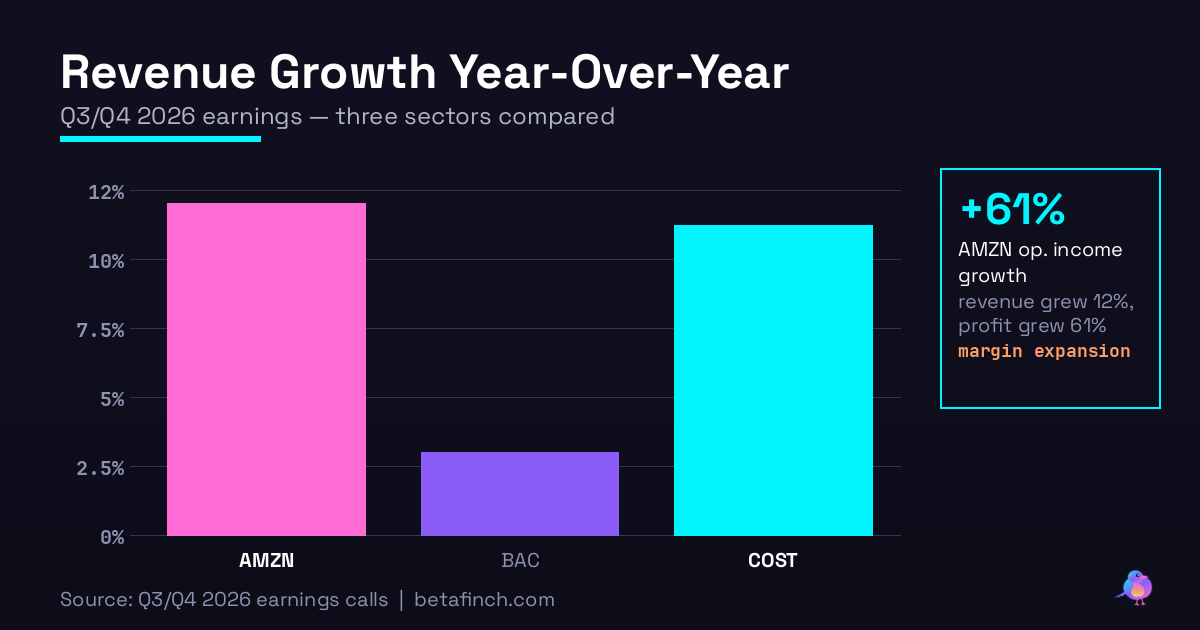
Bank of America's Q3 2026 results illustrate this clearly. The company reported total revenue of approximately $30 billion, up around 3% year over year. Reported EPS came in at $0.91, while adjusted EPS reached $1.08. The $0.17 gap traces to a single item: a $1.2 billion non-tax-deductible AML regulatory settlement charge. Because the charge is non-recurring and non-tax-deductible, its full pre-tax cost passed directly through to reported earnings with no offsetting tax benefit.
For trend analysis, the adjusted figure provides a cleaner view of the underlying business. The settlement is real, and it reduced cash, but it does not reflect the trajectory of BAC's core lending and deposit operations. Net interest income reached $16.6 billion in Q3 2026, up 8% year over year, driven by a net interest yield of 2.16% across a loan book of $1.25 trillion. Those figures were not distorted by the settlement charge, but they would have been obscured if a reader stopped at the headline EPS number. The discipline is to identify every reconciling item, verify it is genuinely non-recurring, and then decide which figure the analysis requires.
Skill 3: Look Past Top-Line Revenue for Operating Leverage
Revenue growth is the most visible metric in any earnings release. It is also, frequently, the least informative one for assessing how efficiently a business is performing.
Amazon's Q3 2026 numbers make the case. Total revenue reached $201.9 billion, up 12% year over year. That is a substantial result for a company at that scale. But operating income grew to $28.1 billion, up 61% year over year on the same 12% revenue increase. The 49-percentage-point gap between those two growth rates is the operating leverage signal: costs grew slower than revenue, and the business converted a higher share of each incremental dollar into profit.
This pattern tends to emerge when a capital-intensive business passes its peak investment phase and fixed costs begin to spread across a larger revenue base. For Amazon, efficiency extended to the customer level as well: customers using Amazon's custom silicon saved more than $2 billion in Q3 alone, a figure that reflects infrastructure cost optimization at meaningful scale. When operating income is growing at five times the rate of revenue, the headline growth number substantially understates the improvement in business economics.
Skill 4: Use Membership and Cohort Data as Leading Indicators
For businesses with subscription or membership models, cohort-level data frequently predicts revenue trends before they fully appear in reported sales figures. These metrics are worth tracking across multiple quarters to identify acceleration or deceleration early.
Costco's Q4 FY2026 results provide a detailed example. Net sales reached $93.87 billion, up 11.2% year over year. Comparable sales grew 9.4% overall, or 6.7% excluding gas prices and foreign exchange effects. Both figures reflect current-period strength. The more forward-looking data sits in the membership table: Costco counted 42.3 million paid executive members at quarter end, up 9.4% year over year, out of 84.1 million total members, with a renewal rate of 92.3%.
Executive members spend roughly twice what standard members spend. A 9.4% increase in that cohort, combined with a 3.3% traffic increase and a 5.9% average transaction increase, describes demand that is growing in both volume and depth. Digital comparable sales rose 19.5%, adding a channel dimension to the picture. The renewal rate above 90% is a retention floor that limits downside scenarios across most economic environments.
Key Numbers
Revenue: $201.9B
Revenue Growth: +12%
Operating Income: $28.1B
Operating Income Growth: +61%
Revenue: $30B
Revenue Growth: +3%
Nii: $16.6B
Nii Growth: +8%
Revenue: $93.87B
Revenue Growth: +11.2%
Comp Sales: +9.4%
Exec Members: 42.3M
Skill 5: Decode Forward Guidance Language
Not all guidance carries the same analytical weight. Some companies commit to numerical floors; others use directional language. The difference matters for how much precision can be assigned to a forecast.
Bank of America's Q3 2026 call included an explicit, quantified revision: management raised full-year 2027 net interest income guidance to 8% growth or more. That guidance rests on concrete data, including NII of $16.6 billion in Q3 2026 (up 8% year over year), a net interest yield of 2.16%, and a loan portfolio of $1.25 trillion. When a company provides a numerical floor like "8% or more" rather than a phrase like "expect continued growth," it is committing to a minimum trajectory that analysts can model and revisit across subsequent quarters.
Amazon, by contrast, guided for AWS growth north of 40% in 2027 and 2028 through confident-range language anchored in the backlog and demand pipeline. That approach conveys management conviction without a numerical commitment. Neither style is superior, but they carry different degrees of analytical precision. A raised numerical floor from a company with a large, measurable loan book and a disclosed yield warrants more weight than a reaffirmed directional range.
A Five-Question Checklist
Apply these questions to any earnings transcript:
- What metric did management emphasize in the opening narrative, and does it align with the financial tables?
- Where do reported and adjusted figures diverge, and is each reconciling item genuinely non-recurring?
- Did operating income grow faster or slower than revenue, and what explains the gap?
- What does cohort or segment data suggest about demand momentum in the next two to three quarters?
- Did forward guidance use a numerical floor or directional language, and was it raised, reaffirmed, or narrowed from the prior period?
For detailed coverage of each company in this guide, the Beta Finch earnings podcasts cover the [Amazon Q3 2026 earnings](/podcasts/AMZN_Q3_2026) and [Bank of America Q3 2026 earnings](/podcasts/BAC_Q3_2026) alongside [Costco Q4 2026 earnings](/podcasts/COST_Q4_2026) in full audio episodes.