Alphabet Q3 2026 Earnings: A Cloud Margin Inflection, a $51B Capex Quarter, and an $8.2B Investment Loss
The Shape of the Quarter
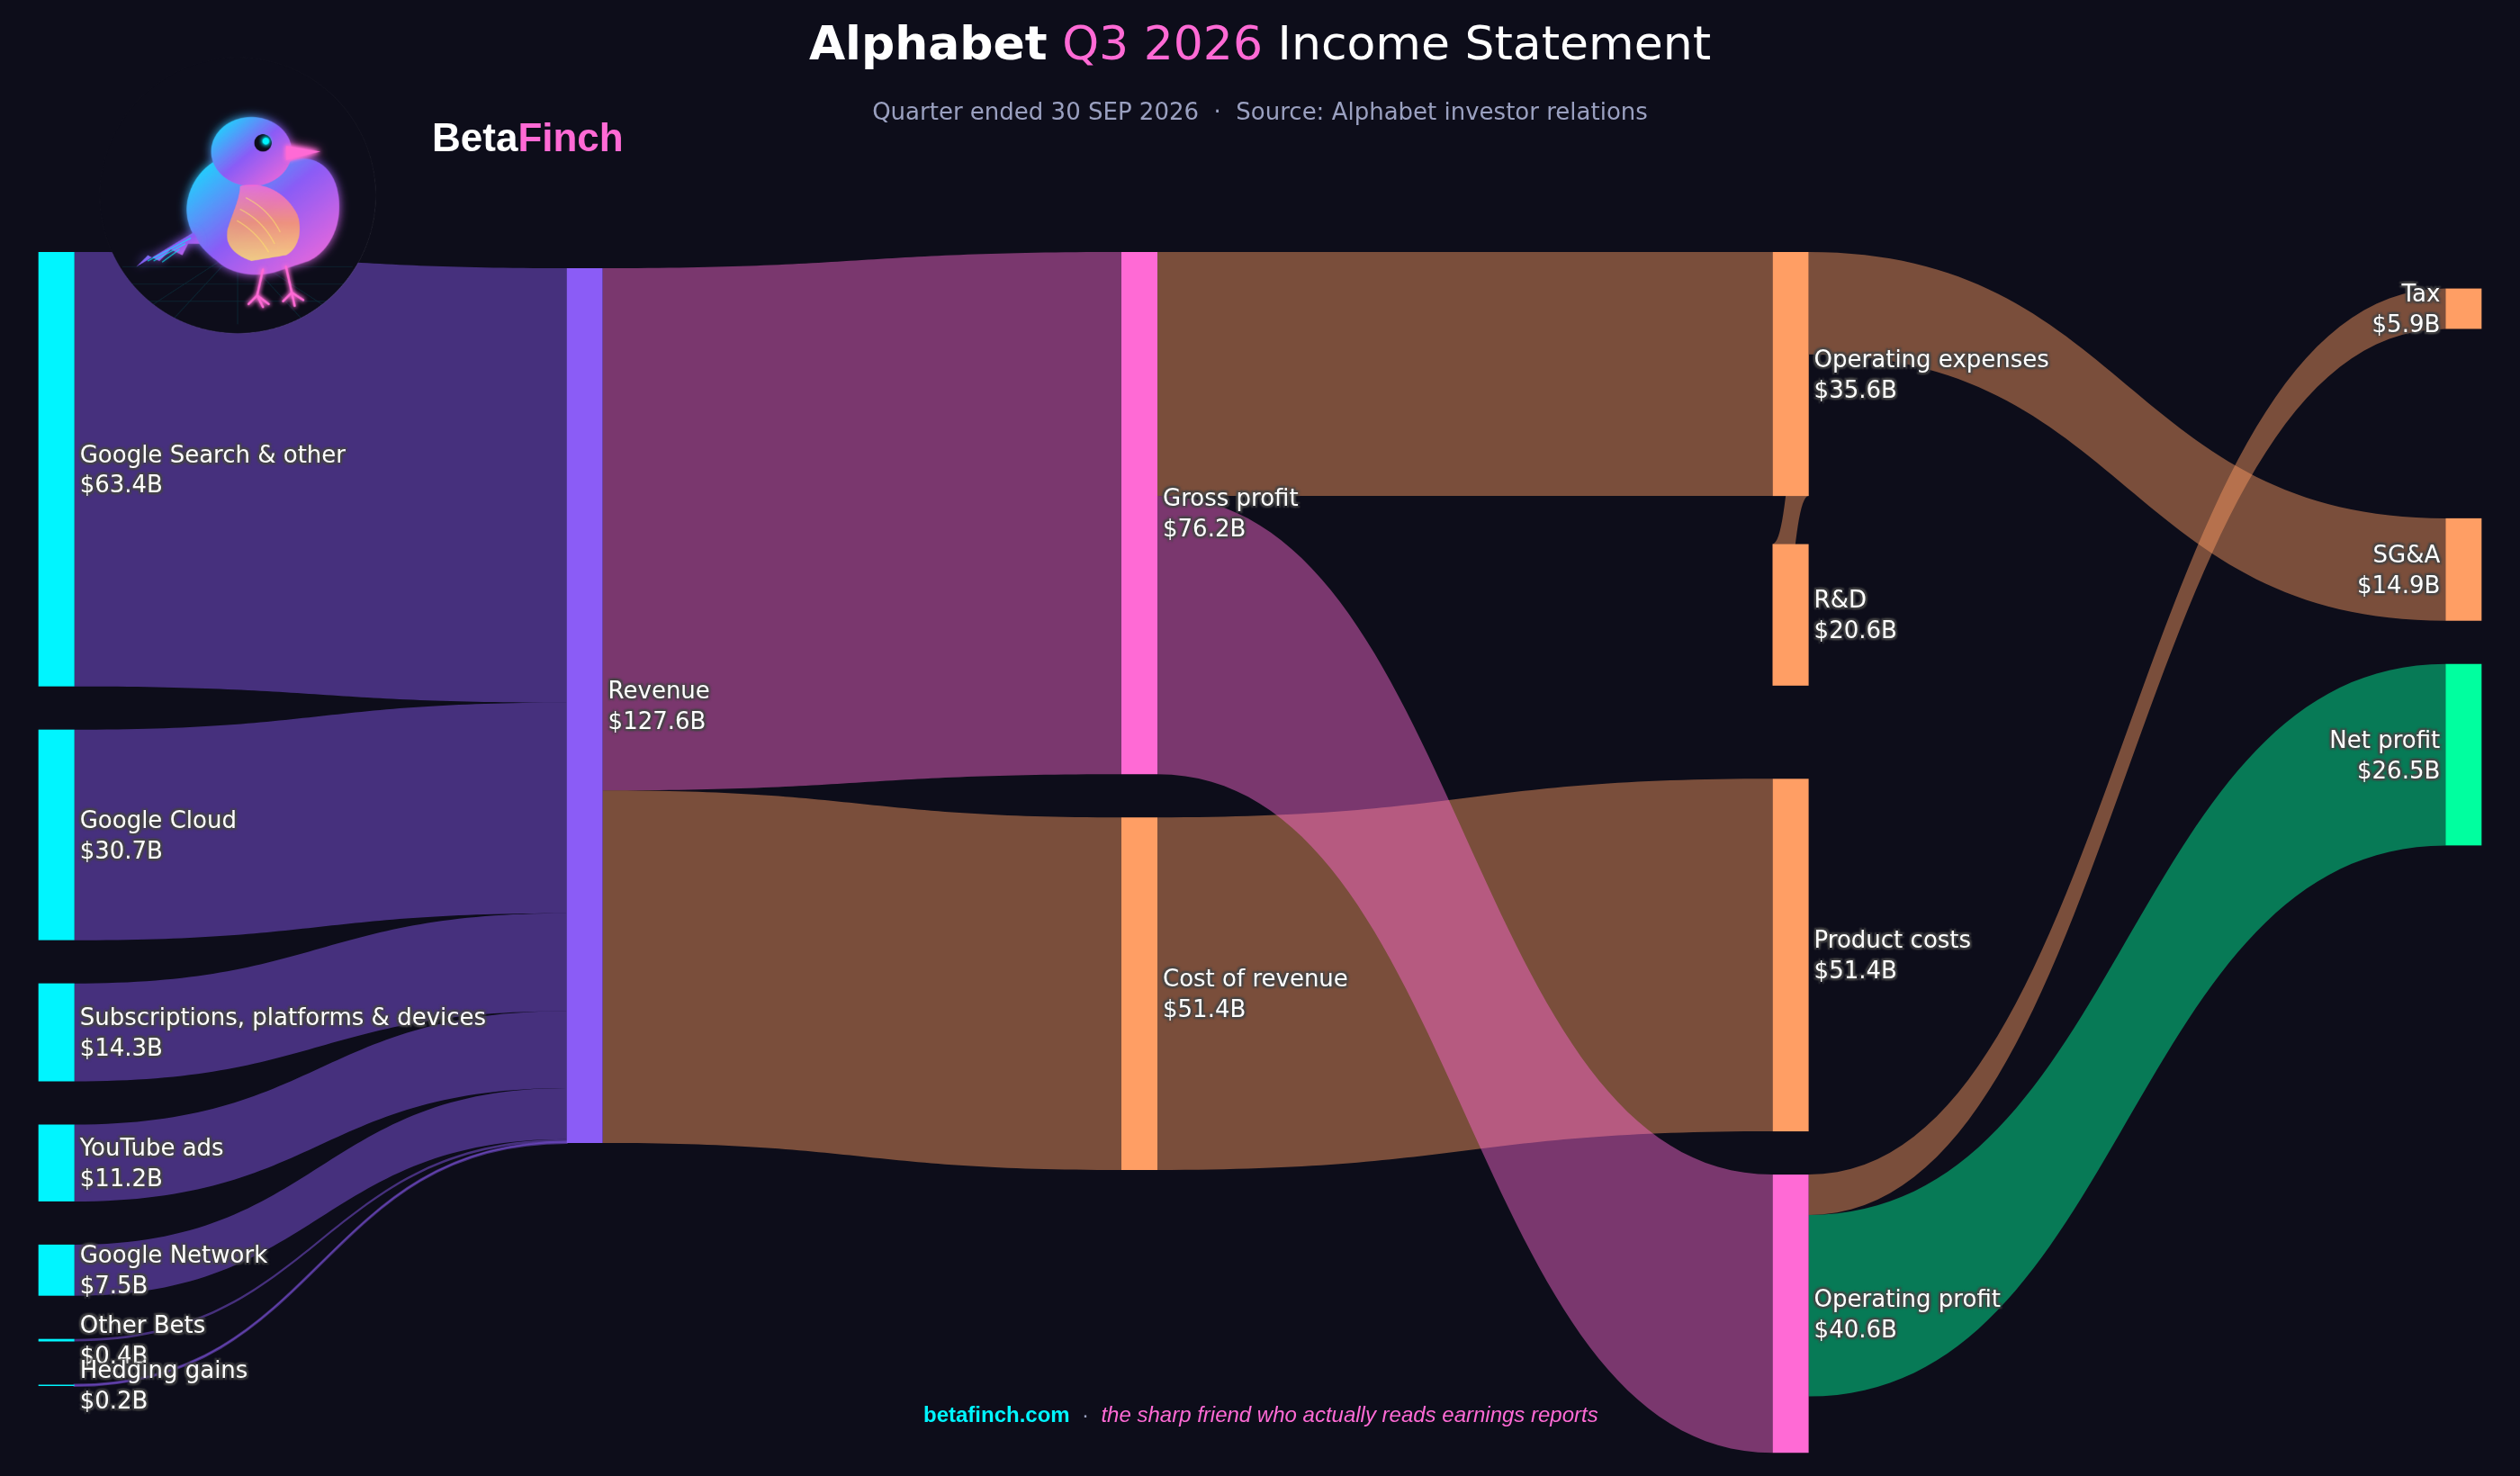
Alphabet (GOOGL) reported Q3 2026 revenue of $127.6 billion, up 25 percent year over year. Income from operations reached $40.6 billion, a 31.8 percent operating margin. Net income, however, came in at $26.5 billion, down about 24 percent year over year, because of a large swing in non-operating investment results.
The split between operating momentum and bottom-line volatility is the structural story of the quarter. Operating income grew about 30 percent year over year, while diluted earnings per share fell to $2.12 from $2.87 a year earlier. The gap between those two trajectories is explained almost entirely by one line below operating income, which is covered later in this piece.
Before that line, the quarter deserves to be read on its operating merits: revenue mix by segment, the Google Cloud margin print, and the capital spending required to run the business at this scale.
Google Services Delivered $96.3 Billion of Revenue
Google Services revenue was $96.3 billion in the quarter, up about 11 percent year over year. The segment houses the three businesses most retail investors already know by name: advertising, subscriptions, and platforms and devices.
Google advertising revenue totaled $82.0 billion. Within that line, Google Search and other reached $63.4 billion, and YouTube ads contributed $11.2 billion. The remainder came from Google Network. Subscriptions, platforms, and devices rounded out the Services total, covering YouTube subscription products, Google One, Pixel, and related lines.
The 11 percent year-over-year growth rate is lower than the headline-grabbing Cloud numbers, but it is the base on which Alphabet's cash generation rests. Search advertising alone is roughly double the size of all of Google Cloud, and continues to compound in dollars at a double-digit rate. Growth of that pace on a $63.4 billion quarterly line adds billions of dollars of revenue every year.
Google Cloud Crossed a Margin Line
Google Cloud revenue was $30.7 billion, up 103 percent year over year, more than doubling. The segment is now Alphabet's second-largest revenue line and has moved from a growth-stage reporting unit to a scale business.
Google Cloud operating income was $11.1 billion, a 36.2 percent operating margin. That compares with 23.7 percent in the same quarter a year earlier, a 1,250-basis-point expansion in twelve months. The incremental operating income on the incremental revenue is high enough that the segment is contributing meaningfully to consolidated profit growth, not just revenue growth.
The multi-quarter arc is just as important as the single data point. Cloud operating margin was running near 18 percent as recently as a few quarters ago, climbed into the mid-20s, and has now reached 36.2 percent. Reaching the mid-30s puts Google Cloud in a margin band that overlaps with the broader hyperscaler peer group, a profile shift that changes how the segment contributes to consolidated earnings and how it is modeled going forward.
Segment Operating Income Reconciles to $40.6 Billion
Consolidated income from operations of $40.6 billion is the sum of Google Services operating income, Google Cloud operating income of $11.1 billion, and losses from Other Bets and Alphabet-level corporate activities. Google Services remains the largest operating-income contributor by a wide margin, driven by the structural economics of Search.
Google Cloud's $11.1 billion of operating income is a step-change in how the segment reads. A year ago, Cloud was a meaningful but not large contributor to group operating income. At $11.1 billion in a single quarter, it is now a material line in its own right, and growing faster than the base. Other Bets and the Alphabet-level corporate line continue to run at a loss, consistent with prior quarters.
The result is a consolidated 31.8 percent operating margin on $127.6 billion of revenue, a figure that would have been near the high end of Alphabet's historical range even without the Cloud contribution. With Cloud now expanding margins at this rate, the group-level margin picture becomes less dependent on Services alone.
Capital Expenditures Reached $51.4 Billion in a Single Quarter
Capital expenditures were $51.4 billion in Q3 2026, up about 114 percent year over year. That is more than doubling the capex run rate in twelve months, and it sets a quarterly record for the company.
To scale that number against the business, $51.4 billion of quarterly capex is larger than $30.7 billion of quarterly Google Cloud revenue. Alphabet is spending more on infrastructure in a quarter than its Cloud segment brings in during the same quarter. Historically, hyperscalers have not often sustained a capex-to-segment-revenue ratio above one for long periods, which is why the figure stands out even against a decade of rising infrastructure budgets.
The bulk of this spending is tied to AI infrastructure, including data centers, servers, and networking equipment. The build-out supports both internal workloads and third-party Google Cloud customers. Depreciation from the current capex cycle will flow through the income statement over the coming quarters, which is a key reason Cloud and group-level margins deserve to be watched closely rather than extrapolated in a straight line.
Why Net Income Fell While Operating Income Rose
Net income was $26.5 billion in Q3 2026, down about 24 percent year over year. Income from operations rose about 30 percent in the same window. The two numbers moved in opposite directions because of the Other income (expense), net line, which sits below operating income on the income statement.
Other income (expense), net was negative $8.2 billion in Q3 2026, compared with positive $12.8 billion a year earlier. The swing from a $12.8 billion gain to an $8.2 billion loss is roughly $21 billion, before tax, in a single line item. The driver was an unrealized loss on equity securities carried on Alphabet's balance sheet. The company's earnings release does not identify the specific investment.
The equity-securities mark reduced net income by roughly $6.7 billion in the quarter after tax. On a per-share basis, it cut diluted earnings per share by about $0.55. Diluted EPS came in at $2.12, down from $2.87 a year earlier. Backing out the mark, the EPS line would have tracked the direction of operating income rather than moving against it.
Mechanically, this is an accounting mark, not a cash outflow. Under current US GAAP rules, changes in the fair value of equity investments flow through the income statement each quarter whether the position is realized or not. The result is that Alphabet's reported net income and diluted EPS will carry more quarter-to-quarter noise than operating income for as long as the portfolio of equity securities remains material to the balance sheet.
What the Quarter Shows Structurally
The quarter contains four distinct signals, and they do not all point the same way. Google Services kept growing in the double digits off a very large base. Google Cloud more than doubled revenue year over year and crossed into a mid-30s operating-margin band. Capital expenditures more than doubled year over year to a quarterly record. Net income fell because of a non-operating investment mark that did not touch operating cash generation.
For Alphabet, operating momentum is accelerating in the segment that was previously the margin drag, while the bottom line now carries more non-cash volatility than it used to. Those two trends are likely to coexist for several quarters, and separating them is the main analytical task when reading each future print. The reported EPS line and the operating income line can diverge sharply when equity marks move, and Q3 2026 is a clear example of just how large that divergence can be in a single period.
Alphabet Q3 2026 by the Numbers
- Total revenue: $127.6 billion, up 25 percent year over year
- Income from operations: $40.6 billion, 31.8 percent operating margin
- Google Services revenue: $96.3 billion, up about 11 percent year over year
- Google advertising revenue: $82.0 billion, with Google Search and other at $63.4 billion and YouTube ads at $11.2 billion
- Google Cloud revenue: $30.7 billion, up 103 percent year over year
- Google Cloud operating income: $11.1 billion, 36.2 percent operating margin, up from 23.7 percent a year earlier
- Capital expenditures: $51.4 billion, up about 114 percent year over year
- Other income (expense), net: negative $8.2 billion, compared with positive $12.8 billion a year earlier
- Equity-securities loss impact: reduced net income by roughly $6.7 billion and diluted EPS by about $0.55
- Net income: $26.5 billion, down about 24 percent year over year
- Diluted EPS: $2.12, down from $2.87 a year earlier